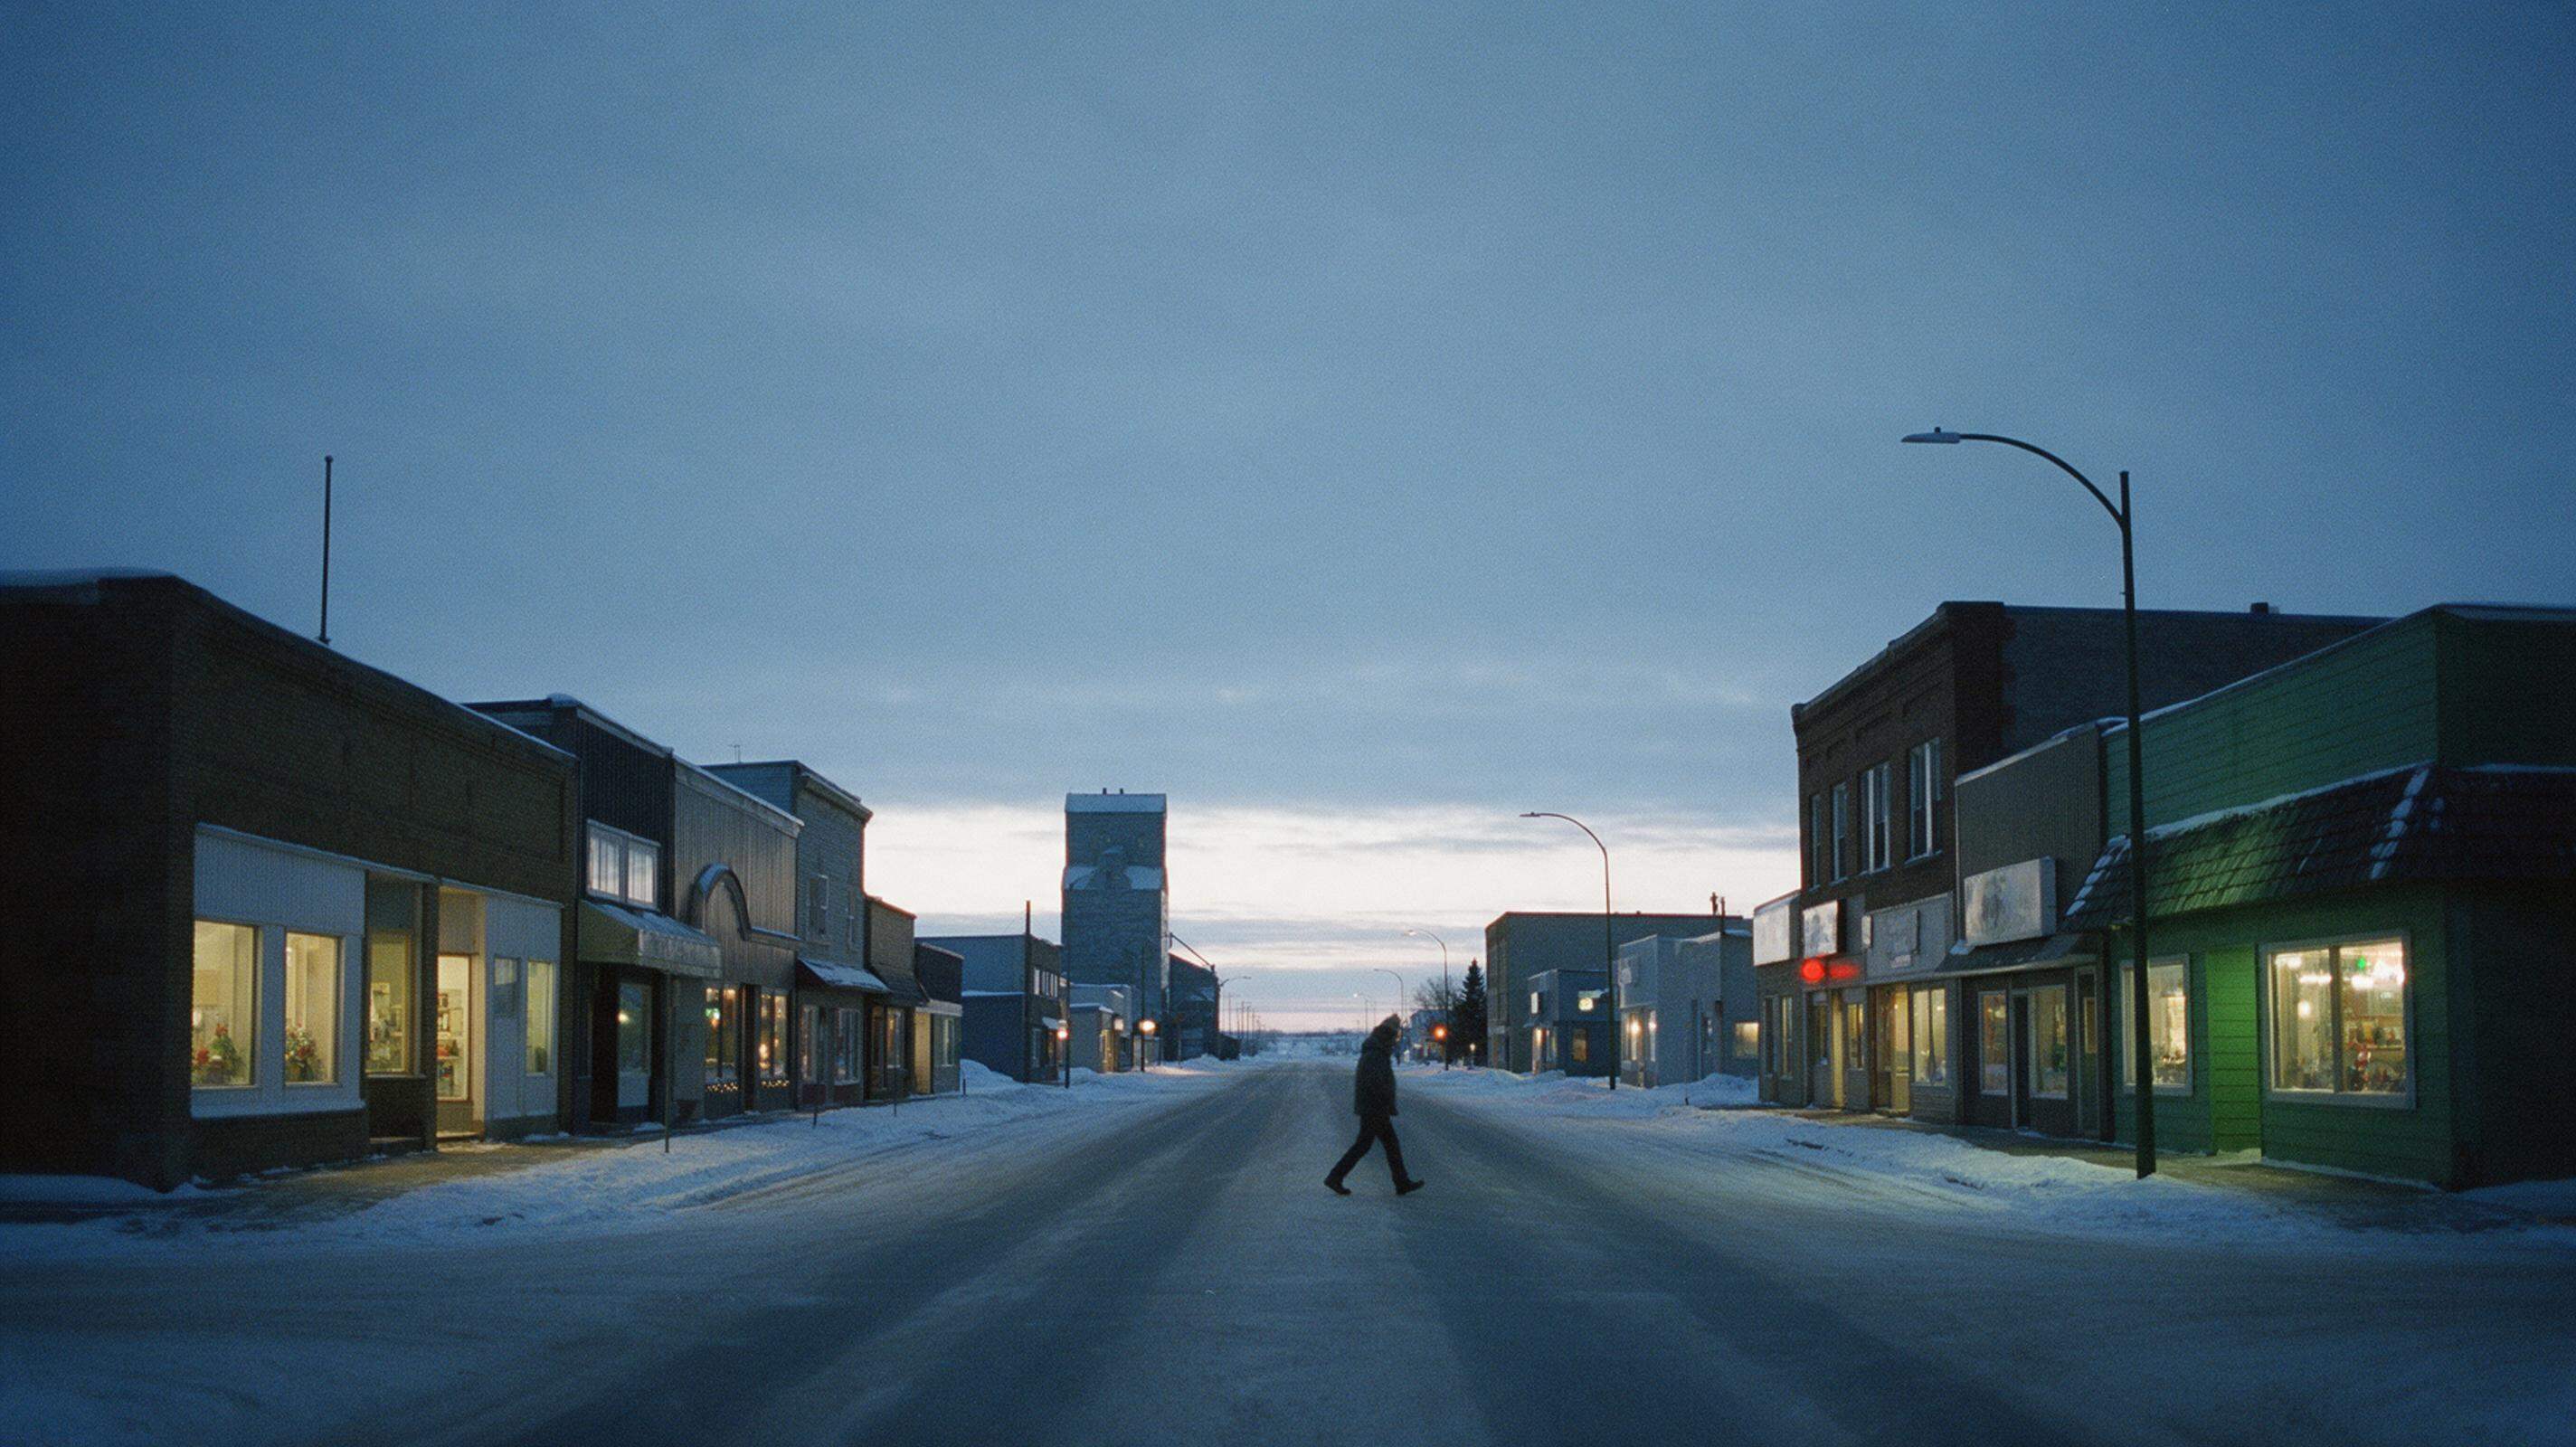

A snowy main street in a Canadian prairie town at blue hour, shop windows lit and a grain elevator down the road.

A Canadian editorial journey

Figures dated, not live

The economy,
closer to home.

Three chapters through prices, work and the cost of getting there. Built from dated official releases — and from the arithmetic that connects them to a household.

All-items CPI

+3.1%

Sept 2026

Average weekly earnings

+3.7%

Aug 2026

Groceries

+1.7%

Sept 2026

Dated releases are linked throughout. Worked examples are hypothetical or illustrative, never live data.

The premise

The premise

Prices are a place, not a percentage.

Last checked

September 2026 CPI, released October 19, 2026

Statistics Canada release

Most economic coverage gives you a rate and moves on. Boreal Metrics starts somewhere more useful: at the shelf, the pay stub and the bus shelter, where a national average becomes a household decision.

The project has three scenes, two explainers and one calculator. Each scene is a place you can walk through, with three discoveries pinned to dated figures from Statistics Canada. Each explainer does the slower work: defining what the numbers measure, showing the arithmetic, and being explicit about what the arithmetic cannot tell you.

The distinction that holds the whole site together is simple and routinely blurred. Inflation is a rate of change. The price level is where prices now sit. A rate can fall while the level stays high — which is exactly what groceries have done. The second distinction is quieter: a raise is not purchasing power until it is divided by the change in prices.

There are no forecasts here, no investment advice and no live data feed. Every statistic is labelled with its reference period and release date. Every worked example is labelled hypothetical or illustrative. If a number cannot be traced to a published release, it does not appear on the site.

The aim is not to tell you what to think about the Canadian economy. It is to leave you with a few durable tools: the difference between a level and a rate, the ratio behind a real wage, and a clearer sense of which parts of the basket are actually yours.

Three chapters

Step into a scene.

Choose a place, then tap a numbered marker. Each discovery carries a dated figure and a link to the release behind it.

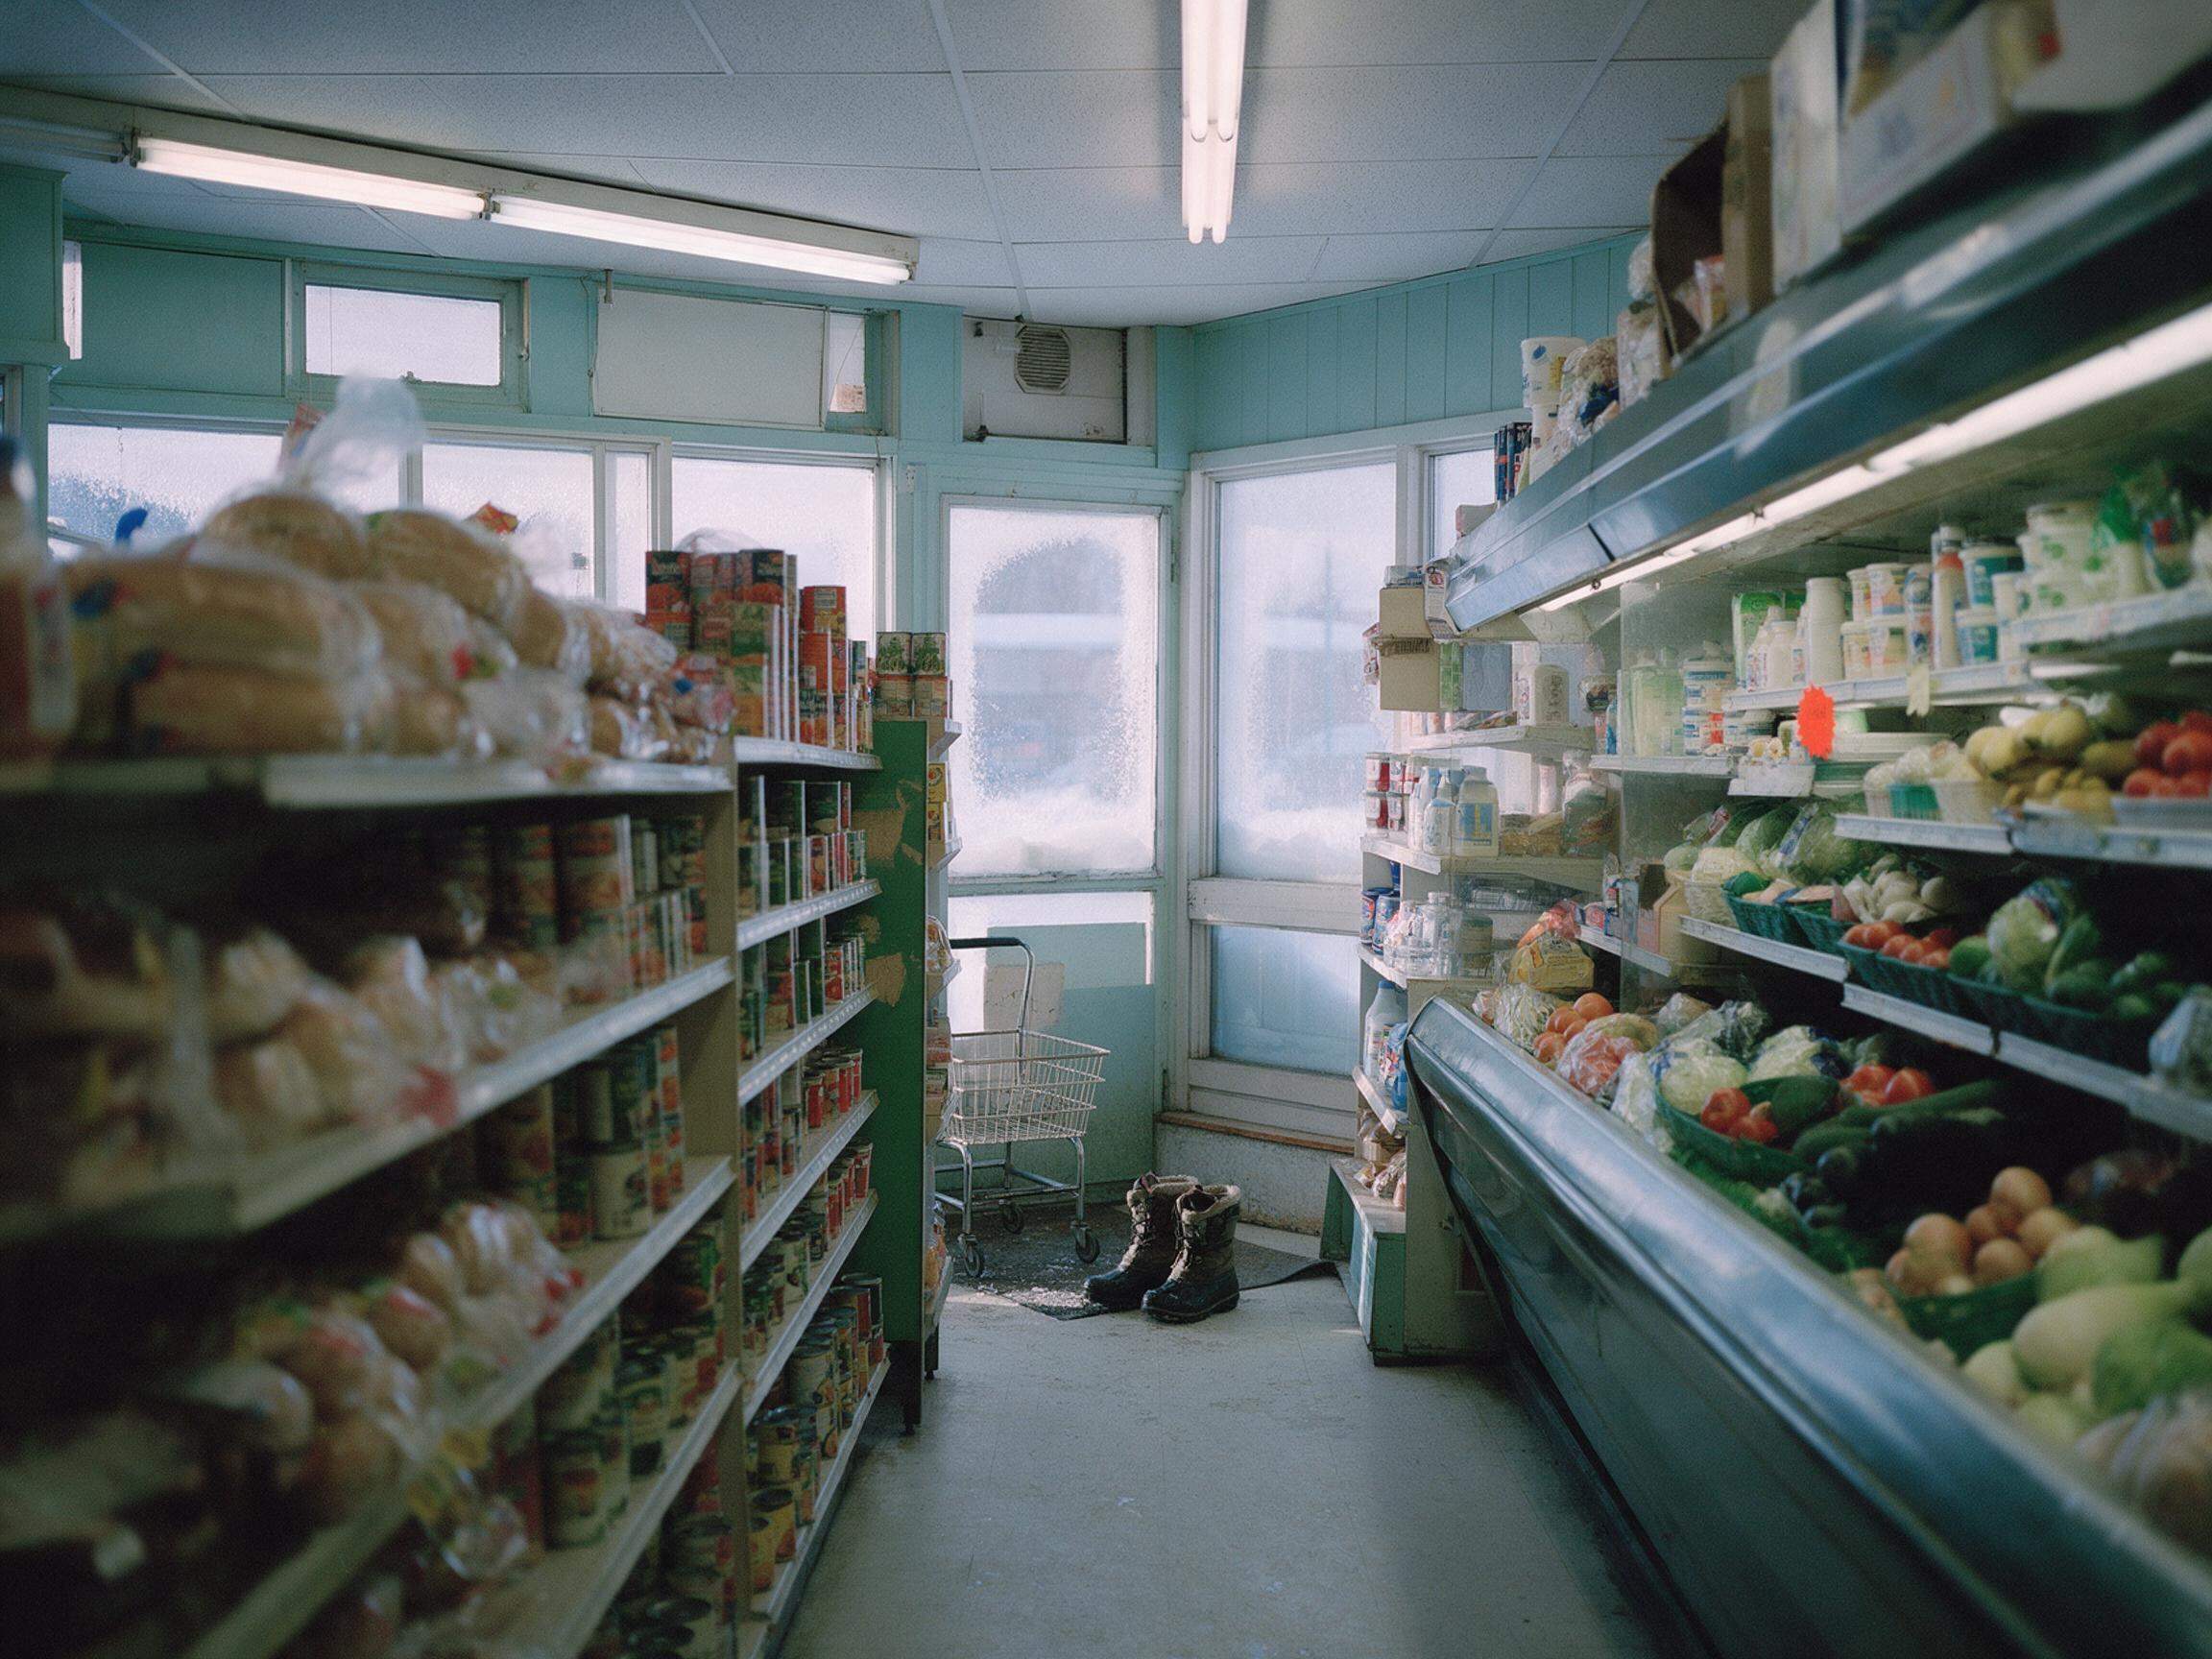
A narrow grocery aisle with bread, canned goods and produce, frost on the windows and winter boots by the door.

Illustrative scene

1 / 3 discoveries

Discovery 01

The bread shelf

1.7%

Grocery prices, 12-month change, September 2026

Food purchased from stores rose 1.7% in the year to September 2026, the smallest yearly increase since May 2024. It was also the second month in a row that grocery price growth ran slower than the all-items index.

Slower is not lower. Prices are still rising — just less quickly than they were — and the level they have reached does not come down when the rate does.

Source

Statistics Canada, Consumer Price Index, September 2026. Released October 19, 2026.

Read the release
Full chapterThe basket

All nine discoveries are also listed in text on each chapter page, so nothing depends on a pointer.

All chapters

The arithmetic

The raise, the receipt, and the number in between.

Average weekly earnings rose 3.7% in the year to August 2026. The CPI rose 3.1% in the year to September 2026. The releases cover different periods, so the two rates cannot be divided into a real wage outcome. The worked example below is hypothetical and same-period: 5% income growth against 3% inflation.

Read the long version

Purchasing power, worked

Hypothetical example

The calculation

real change equals one plus income growth, divided by one plus inflation, minus one. Income growth and inflation are entered as decimals.

g = income growth as a decimal (5% = 0.05). i = inflation as a decimal (3% = 0.03). Rates are divided before subtracting one; this is a ratio, not a difference of percentages.

Enter as a percentage. 5% becomes 0.05 in the formula.

Prices rising 3% means the formula divides by 1.03.

Example presets

Real change in purchasing power · hypothetical

+1.94%

Income grew faster than prices: purchasing power rose.

Rates as decimals
g = 0.050 · i = 0.030
Subtracting the rates instead
+2.0 percentage points

A difference of percentage points is an approximation. The ratio above is the correct comparison because the basket is priced at the new level.

The fields start from a hypothetical same-period example: 5% income growth and 3% inflation. They are not a pairing of the dated releases. Average weekly earnings for August 2026 (up 3.7% year over year, released October 29, 2026) and the CPI for September 2026 (up 3.1% over twelve months, released October 19, 2026) cover different reference periods, so they are cited separately and are never divided into a real wage outcome here. This is not a forecast or live data.

The calculator runs entirely in your browser. It sends nothing, stores nothing and uses no live data. Its default is a hypothetical same-period example, not a combination of the dated releases above. Definitions and the limits of the formula are set out in Method & sources.

Release calendar

October 2026 CPIListed by Statistics Canada

Release dates are set by Statistics Canada, not by this publication. Boreal Metrics reports published figures only: it does not forecast the next number and does not schedule automated updates.

Official release calendar

What to watch

  • 01The all-items rate against the 3.1% recorded for September.
  • 02Groceries, where the yearly rate slowed to 1.7% while the level stayed high.
  • 03Shelter and rent, the least negotiable lines in most budgets.
  • 04Gasoline, the component most responsible for the September acceleration.

The CPI figures currently cited are for September 2026. Read how we date, source and correct them in Method & sources.

Two explainers

The slow version of two headlines.

Long-form pieces on the two ideas that do most of the work on this site: the price level versus the inflation rate, and income versus purchasing power.

All explainers