The basket
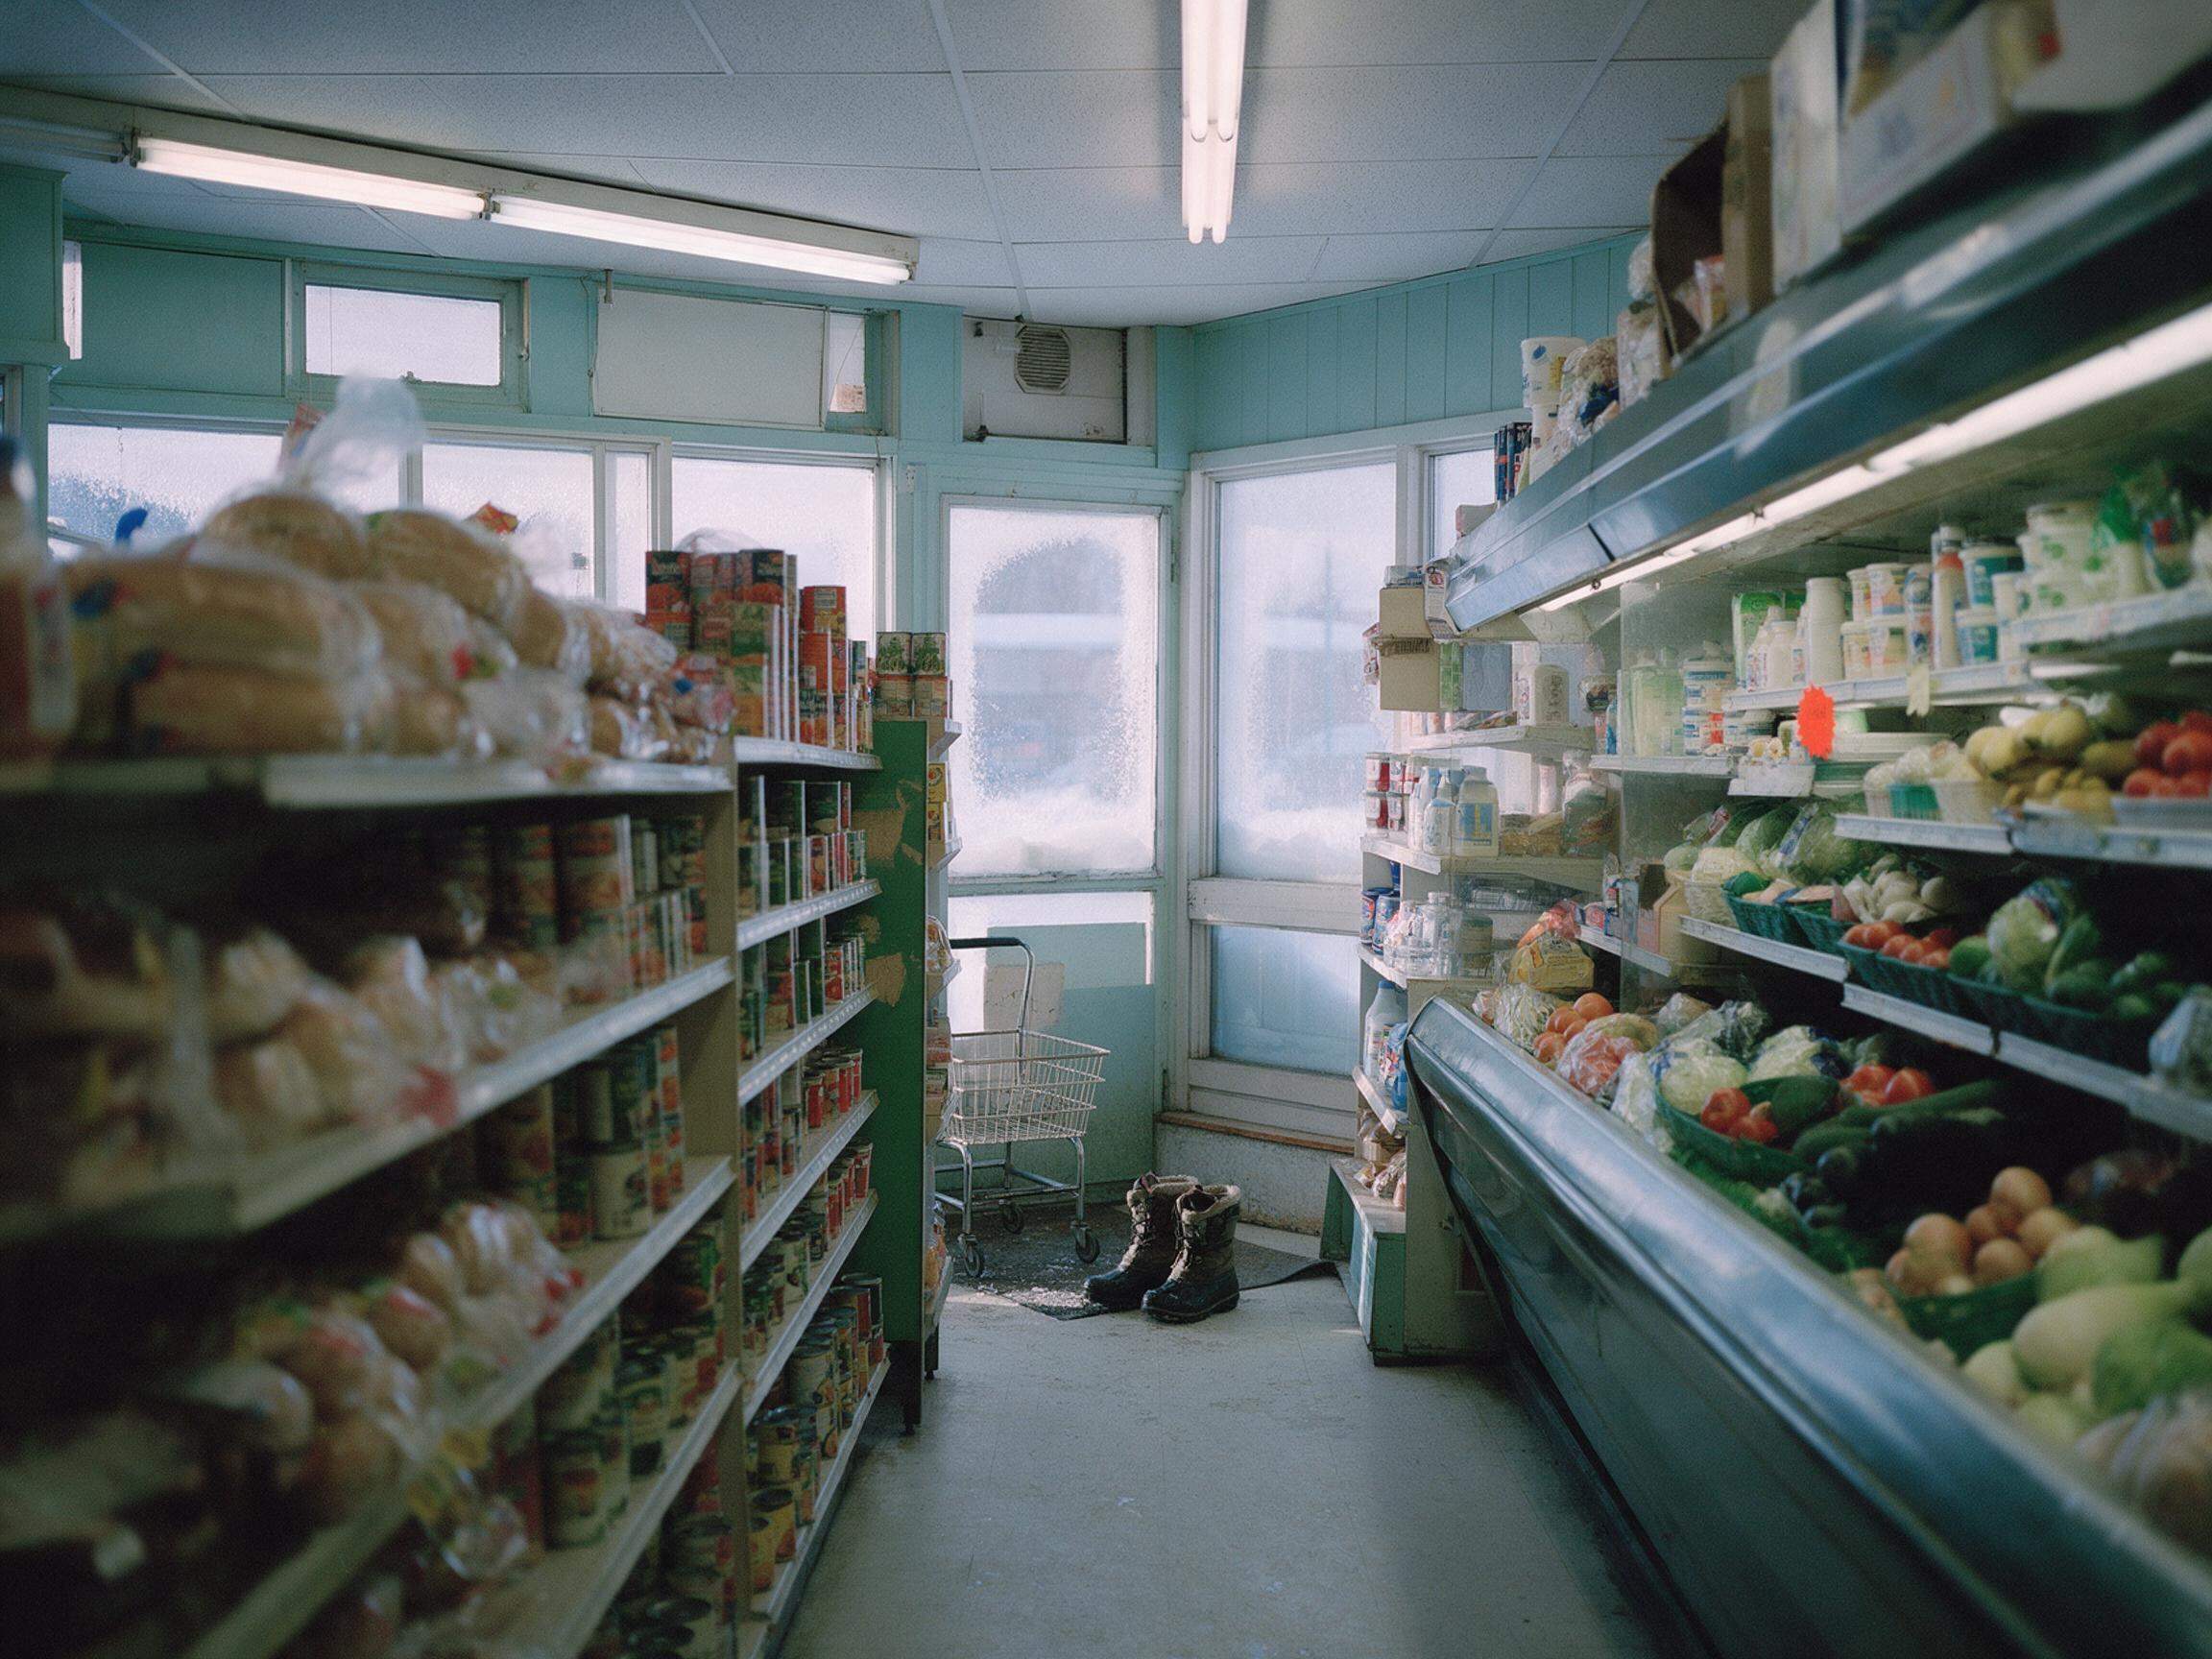
A grocery aisle is the most honest inflation exhibit in the country. Every shelf holds a price, and every price holds a decision.
Prices · Scene I
Tap a marker
1 / 3
Discoveries in this chapter
Figures are dated and linked. Nothing on this page updates itself.
Discovery 01 of 03
The bread shelf
1.7%
Grocery prices, 12-month change, September 2026
Food purchased from stores rose 1.7% in the year to September 2026, the smallest yearly increase since May 2024. It was also the second month in a row that grocery price growth ran slower than the all-items index.
Slower is not lower. Prices are still rising — just less quickly than they were — and the level they have reached does not come down when the rate does.
Source
Statistics Canada, Consumer Price Index, September 2026. Released October 19, 2026.
Read the releasePublished figures describe national averages. They are not a forecast, and they are not your household.
Official releaseScene notes
What this chapter adds to the two explainers, and what it leaves out.
This is a small grocery store, the kind with frost on the inside of the windows and a cart by the door. It is not a statistical abstraction. It is where the Consumer Price Index meets a Tuesday.
Three things on these shelves explain more about the Canadian price story than the headline number alone: what a price level is, what an inflation rate is, and why the two are constantly mistaken for each other.
Read the explainer
Why a slowing inflation rate and a high price level can be true at the same time.